
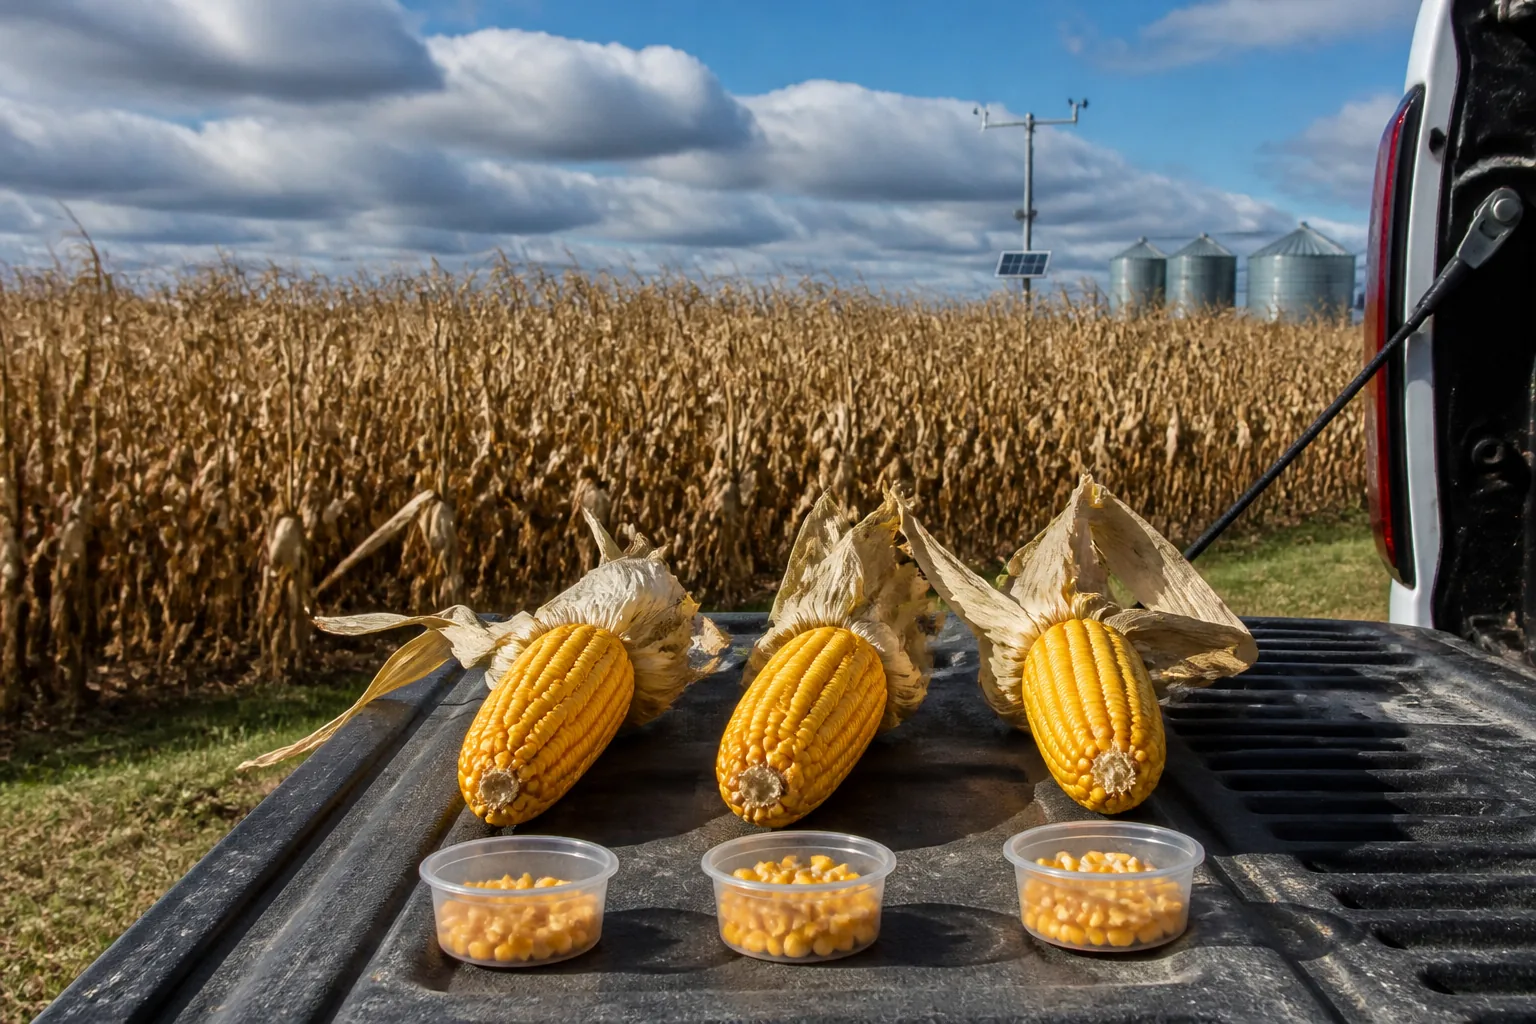
After corn reaches physiological maturity, grain moisture may fall about 0.75 to 1 percentage point per day during sunny, warm, breezy weather in the earlier part of harvest, but only about 0.25 to 0.5 point per day in late October to early November. By mid-November, field drydown may slow to 0 to 0.25 point per day. These are planning ranges from Ohio State Extension, not a fixed rate for every field.
For the next 3 to 10 days, the best working estimate comes from four inputs: today's representative field moisture, confirmation of black layer, local temperature and relative humidity, and repeated measurements from the same field zones. Use a weather-based drydown tool for the first estimate, then replace the forecast with observed field data as soon as another reliable sample is available.
Quick Reference: Expected Drydown by Season and Weather
| Situation | Approximate planning rate | Important limitation |
|---|---|---|
| Favorable mid- to late-September weather | 0.75–1.0 point/day | Requires mature corn and sunny, breezy conditions |
| Early to mid-October | 0.5–0.75 point/day | Actual rate depends heavily on temperature and humidity |
| Late October to early November | 0.25–0.5 point/day | Cool, wet periods can be slower |
| Mid-November | 0–0.25 point/day | Drydown may be negligible |
| Warm, dry fall conditions in Ohio research | 0.76–0.92 point/day | Research range, not a field-specific forecast |
| Cool, wet fall conditions in Ohio research | 0.32–0.35 point/day | Rain and persistent humidity can interrupt progress |
These ranges describe percentage points of moisture, not a percentage of the current reading. Corn moving from 25% to 24% has lost one moisture point.
The calendar is useful, but weather and current moisture are more important. A warm, dry five-day period in October can outperform a humid week in September. Conversely, extending an early-September rate into November can overstate drydown by several points.
First Confirm That the Corn Has Reached Black Layer
Normal post-maturity drydown forecasts apply after physiological maturity, when a black layer forms at the base of the kernel and dry-matter accumulation has ended. Corn is often still near 30% or higher at this stage, although the actual moisture varies by hybrid and season.
Before black layer, a falling moisture reading is occurring while grain fill may still be active. A model designed for post-maturity drydown should not be used as if the crop were already mature. Frost-killed immature corn also requires extra caution because kernel development, cob moisture, test weight, and drydown behavior can differ from normally matured corn.
Check several representative ears in each field or maturity zone. Do not assume the entire field reached black layer on the same day when planting dates, hybrids, soils, or stress levels differ.
Method 1: Use the Iowa State Corn DryDown Calculator
The Iowa State Corn DryDown Calculator is the most practical starting point for a 5- or 10-day estimate across the U.S. Corn Belt. The operator selects a location, enters the observation date and current grain moisture, and receives projected daily moisture values.
Iowa State explains that the tool uses temperature and relative humidity to estimate the atmosphere's drying potential. It combines current and historical weather information with forecast data and applies an equilibrium-based model developed from field research.
How to use the result correctly
1. Confirm black layer in the area being modeled. 2. Enter a moisture value based on multiple representative samples, not one ear. 3. Select the field's actual location rather than a distant regional average. 4. Record both the 5-day and 10-day projections. 5. Treat the 5-day output as an operating estimate and the 10-day output as a planning range. 6. Resample after 48 to 72 hours and compare actual change with predicted change. 7. Update the input whenever rainfall, frost, unexpected humidity, or a large forecast revision occurs.
The calculator cannot see field-specific stalk condition, ear orientation, husk characteristics, local fog, disease, or within-field moisture variation. It predicts drying conditions; it does not decide whether the field is safe to leave standing.
If the result suggests corn will move from 24% to 21% over the next five days, that forecast means little unless the field can tolerate five more days of exposure. Use the decision framework in Should I Harvest Wet Corn Now or Let It Dry in the Field? to compare the projected saving with field risk and dryer capacity.
Method 2: Use a GDD Estimate as a Cross-Check
Growing degree days provide a simpler backup estimate when a drydown tool is unavailable. Ohio State Extension summarizes general literature indicating approximately:
- 30 GDDs per moisture point as corn dries from 30% to 25%
- 45 GDDs per moisture point as corn dries from 25% to 20%
The larger requirement at lower moisture reflects the tendency for drydown to slow. These are general relationships rather than hybrid-specific rules.
For corn, daily GDDs are commonly calculated with the 86/50 cutoff method:
Daily GDD = ((daily high + daily low) ÷ 2) − 50Use 86°F when the daily high exceeds 86°F, and use 50°F when the daily low falls below 50°F. Add the daily values across the forecast period. A local agricultural weather service may already report the total.
A practical calculation
Suppose a mature field is currently at 27% and the five-day forecast is expected to accumulate 75 GDDs.
1. Moving from 27% to 25% requires about 2 points × 30 GDDs = 60 GDDs. 2. About 15 GDDs remain. 3. Below 25%, divide those 15 GDDs by about 45 GDDs per point. 4. Estimated additional loss is roughly 0.3 point.
The rough five-day estimate is therefore about 24.7% moisture.
Do not extend this arithmetic below 20% or into weather for which the relationship is poorly suited. Rainfall, dew, relative humidity, husk condition, and hybrid effects are not fully represented by a simple GDD total. Use this method to check whether a forecast is plausible, not to create false precision.
Method 3: Build a Field-Specific Observed Rate
Once two representative sampling rounds are available, the field itself becomes the most relevant source of information.
Observed drydown rate
= (earlier average moisture − current average moisture)
÷ number of days between samples
Example:
- Monday field average: 26.4%
- Thursday field average: 24.9%
- Time interval: 3 days
(26.4 − 24.9) ÷ 3 = 0.5 moisture point per dayIf the next three days are expected to resemble the previous three, 0.5 point per day is a useful short-term starting rate. If the forecast changes from warm and dry to cool and wet, reduce the estimate rather than extending the observed slope unchanged.
An observed average without its range is incomplete. If Monday samples ranged from 24% to 29% and Thursday samples ranged from 22% to 28%, the field is not drying uniformly even though the average declined. Harvest and dryer planning must account for the wettest meaningful zones, not just the midpoint.
How to Collect Comparable Moisture Data
Prediction quality cannot exceed sample quality. Changing sampling locations or mixing unlike zones can create an apparent drydown rate that is really a sampling difference.
Use a repeatable procedure:
1. Divide unlike areas. Separate hybrids, planting dates, replant zones, low ground, and visibly stressed areas. 2. Choose several representative locations per zone. Avoid relying on borders or the most convenient rows. 3. Use the same locations or comparable zones each round. The goal is to measure change, not a different population of plants. 4. Collect enough ears to reveal variation. Preserve individual readings before calculating an average. 5. Record conditions. Note date, time, field, zone, recent rainfall, grain temperature, average, and range. 6. Confirm with harvested grain. Once the combine enters the field, compare preharvest samples with grain-stream or load samples.
A portable Grain Moisture Meter is useful for this kind of routine trend checking across multiple samples. Use consistent sample preparation and the applicable corn mode. The operational value comes from repeated, representative comparisons—not from treating a single displayed number as the entire field.
Sampling every few hours usually creates more noise than value. A 48- to 72-hour interval is often long enough for a meaningful field change to emerge, while still allowing the harvest plan to be updated before the next weather event.
Why Temperature Alone Does Not Predict Drydown
Warm air can support faster evaporation, but the moisture-holding condition of the air matters. Relative humidity, rainfall, dew, wind, and solar exposure can change the net movement of water from the kernel.
Relative humidity and equilibrium
Grain exposed to air tends toward an equilibrium moisture content determined by air temperature and relative humidity. When the surrounding air has greater drying potential, moisture moves out of the kernel more readily. During humid periods, the gradient is smaller and net drying slows.
This is why two weeks with similar average temperatures can produce different field results. A sunny, breezy week with lower humidity is not equivalent to a cloudy week with fog, dew, and intermittent rain.
Rain and dew
Rain does not simply “pause the daily rate.” Wet husks, high humidity, trapped water in upright ears, and reduced solar drying can suppress progress after the event. Moisture readings can also temporarily rise. Use a new field sample after rain rather than subtracting a standard number of lost drying days.
Wind and sunlight
Air movement and solar radiation help remove humid air around the ear and husk. Dense canopies, lodged plants, or ears close to the ground may dry differently from well-exposed ears in the same field.
Why Current Moisture Changes the Rate
Corn does not normally lose each point at the same speed. The general GDD relationship indicates that moving from 30% to 25% requires fewer heat units per point than moving from 25% to 20%.
This creates a common forecasting error: a field loses three points quickly, so the operator assumes the next three points will take the same number of days. As corn gets drier—and as the season usually gets cooler—the rate can slow from both effects at once.
Use a piecewise estimate:
| Current moisture | Forecast approach |
|---|---|
| Above 30% after normal maturity | Use the Iowa State tool and verify maturity and equipment limits |
| 30%–25% | Tool forecast plus roughly 30 GDDs per point as a cross-check |
| 25%–20% | Tool forecast plus roughly 45 GDDs per point as a cross-check |
| Below 20% | Give more weight to actual field observations and increasing field-loss risk |
For target harvest ranges and why lower is not always better, see What Moisture Should I Harvest Corn At?.
Hybrid and Field Differences Can Be Larger Than the Forecast Error
Hybrids differ in husk looseness, husk coverage, ear angle, kernel characteristics, maturity timing, and genetic drydown behavior. Soil type, drainage, planting date, plant population, drought stress, disease, and replanting add further variation.
Do not apply one field's observed rate to the entire farm without checking:
- A hybrid that reached black layer earlier may be much farther through drydown.
- Replanted corn may remain in the upper 20s while the original stand is near market moisture.
- Upright ears can retain water after rainfall.
- Lodged or diseased areas may have different exposure and quality risk.
- Field edges may dry differently from the interior.
Forecast each meaningful field or zone separately. A farmwide average can be useful for capacity planning, but it is a poor basis for deciding which field to harvest next.
Separate Forecast Error From Sampling Error
When actual moisture differs from the forecast, identify the source before changing the whole plan.
| Possible cause | What to check |
|---|---|
| Different sample locations | Repeat the established route or zone pattern |
| Wide within-field variation | Review individual readings and ranges, not only averages |
| Rain, fog, or heavy dew | Restart the forecast with a new post-event reading |
| Field not fully mature | Recheck black layer in representative ears |
| Hybrid-specific behavior | Track hybrids separately |
| Forecast weather changed | Recalculate with updated conditions |
| Sample temperature or handling changed | Keep the measurement procedure consistent |
The purpose is not to force the field to match a model. The model is an initial schedule; field observations are the correction.
Turn the Forecast Into a Harvest Plan
A useful prediction must change an action. For each field, create three numbers:
1. Expected moisture in 3–5 days for operating decisions 2. Expected moisture in 7–10 days for dryer and labor planning 3. A harvest trigger based on moisture, stalk condition, ear condition, or weather
Example:
Current representative moisture: 24.8%
5-day forecast: 22.2%–23.0%
10-day planning range: 20.5%–22.0%
Trigger: harvest sooner if more than 10% of tested stalks fail,
ear drop increases, or the wind forecast worsens
Use a range rather than one decimal-place promise. The range should widen with time because both weather uncertainty and field variation accumulate.
Then compare the predicted moisture with:
- Combine operating range
- Wet-bin and dryer throughput
- Commercial receiving terms
- Field standability
- Quality and disease risk
- The next reliable field-access window
If a forecasted two-point decline saves drying cost but exposes a weak field to a storm, the forecast has not justified waiting. It has only quantified the drying benefit.
Common Forecasting Mistakes
“Corn always loses half a point per day.”
The rate changes with season, weather, current moisture, and hybrid. Use a fixed rate only as a rough check over a short period with similar conditions.
“No rain means fast drying.”
High humidity, cloud cover, fog, heavy dew, and low wind can slow drydown without measurable rainfall.
“The 10-day forecast is a harvest date.”
It is a planning estimate. Confirm it with a new sample and an updated weather outlook before committing trucks, dryer capacity, or labor.
“The field average is the future moisture of every load.”
Moisture variation can persist through harvest and drying. Track the range and segregate materially different areas where practical.
“If the forecast misses, the field did something abnormal.”
The miss may come from changed weather, nonrepresentative sampling, maturity differences, or hybrid behavior. Diagnose the input difference before discarding the method.
A Practical 3–10 Day Routine
Use this short cycle during harvest:
1. Confirm black layer. 2. Take representative moisture readings and record the range. 3. Run the Iowa State 5- and 10-day forecast. 4. Cross-check with seasonal rates and GDDs. 5. Inspect stalks, ear retention, and disease before deciding to wait. 6. Resample after 48 to 72 hours or after meaningful weather. 7. Calculate the observed rate and revise the forecast. 8. Match the new estimate to dryer, transport, and receiving capacity.
The cycle matters more than the first prediction. A forecast that is updated twice with field measurements becomes far more useful for scheduling than a single early estimate carried forward for ten days.
Bottom Line
Under favorable early-harvest weather, mature corn may lose roughly 0.75 to 1 moisture point per day. As fall becomes cooler and more humid, the rate often slows to 0.25 to 0.5 point per day and may approach zero by mid-November.
For the next few days, start with the Iowa State Corn DryDown Calculator, cross-check the result with the field's current moisture and seasonal GDD relationships, and resample representative zones within 48 to 72 hours. Use the observed change to update the estimate. Forecast moisture as a range, then combine it with field risk and drying capacity before changing the harvest schedule.
Sources and Further Reading
- Iowa State University Extension: The Corn DryDown Calculator—A Tool to Guide Harvest Timing
- Iowa State University FACTS: Corn Drydown Calculator
- Ohio State University Extension: Precipitation, Cooler Weather, and Corn Dry Down
- Ohio State University Extension: Growing Degree Day Maturity Rating System
- NDSU Extension: Predicting Corn Dry Down With a Web-Based Tool
- Martinez-Feria et al.: Evaluating Maize and Soybean Grain Dry-Down in the Field With Predictive Algorithms
- University of Minnesota Extension: Pre-Harvest Considerations for Corn